
The 5th anniversary of Canterbury’s devastating earthquake on 22nd February, 2011 is looming.
A recent after-shock of 5.7 magnitude quake has provided added stress to an already stressed population.
There have been recent reports of increased suicides and suicide-related calls, depression and anxiety in Christchurch since the earthquakes (e.g., in 2012, in 2015).
Most recently, there’s been controversy over claimed funding cuts for mental health services in Christchurch.
In that context, wouldn’t it be great to have some insight into levels of stress in Christchurch, in Canterbury and even in New Zealand?
Well, oddly enough, we do.
Or maybe we don’t.
Take what looks like a longitudinal data set on levels of self-reported stress in six of New Zealand’s major urban centres: Auckland, Porirua, (Lower) Hutt City, Wellington, Christchurch and Dunedin.
Remarkably, it is possible to create a dataset that, every two years, includes a reasonably-sized sample of people in each of these centres who have all answered the same question about their perceived levels of stress.
The question is:
At some time in their lives, most people experience stress.
Can you tell me which statement best applies to how often, if ever, in the last 12 months you have experienced stress that has had a negative effect on you?
The response statements are:
- Always
- Most of the time
- Sometimes
- Rarely
- Never
The question comes from the ‘Quality of Life Project‘, begun in 1999, called to a halt in 2007 but resurrected in abbreviated form by the six urban centres I’ve just mentioned. As explained in the link:
Following several significant events in New Zealand, including the devastating Canterbury earthquakes, the subsequent postponement of the 2011 Census of Population and Dwellings to 2013, the amalgamation of local government in the Auckland region in 2010, and a general tightening of local government funds, a decision was made to disband the wider Project.
However, it was agreed by the core participating councils of Auckland, Wellington, Christchurch and Dunedin to continue in a collaborative partnership with the 2014 Survey.
All the reports/surveys for each of the years 2004, 2006, 2008, 2010, 2012 and 2014 can be downloaded from this link.
Extracting responses to the question on stress – and a number of other related questions – shows some interesting ‘patterns’ over the surveys from 2004 to 2014.
For example, a simple graph of reported levels of stress shows the following:
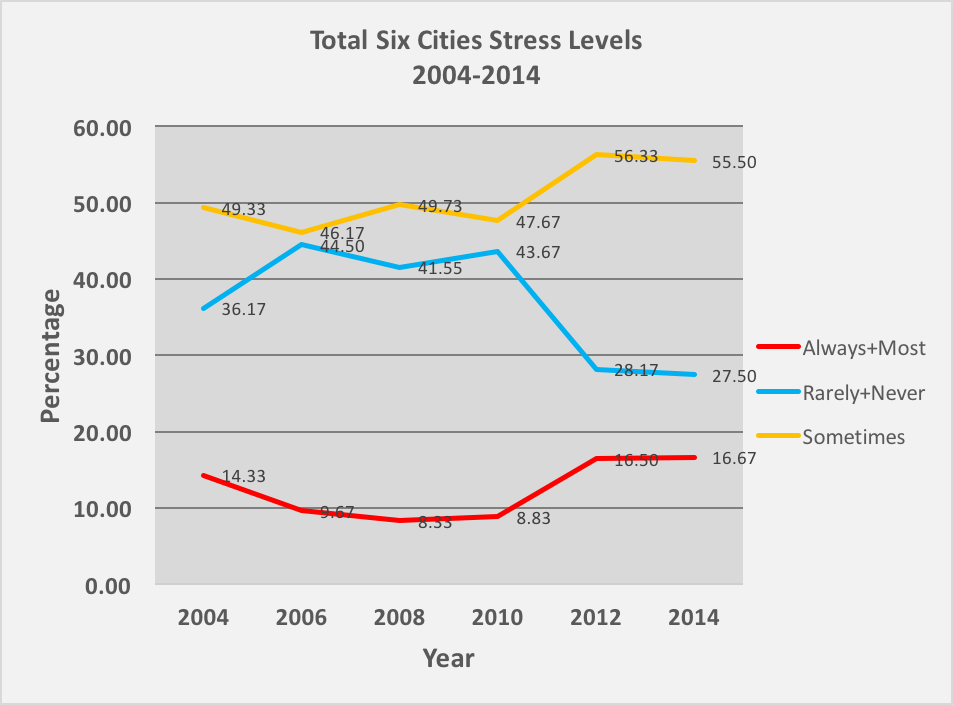
The graph shows the percentage of the sample, in each year and across the six cities, that responded as being ‘Rarely’ or ‘Never’ stressed; ‘Sometimes’ stressed; and ‘Most of the time’ or ‘Always’ stressed.
On first look, the pattern seems clear. In 2004 stress was relatively high then reduced through to the 2010 survey period. Then, in 2012 and 2014 stress levels increased to levels greater than in 2004.
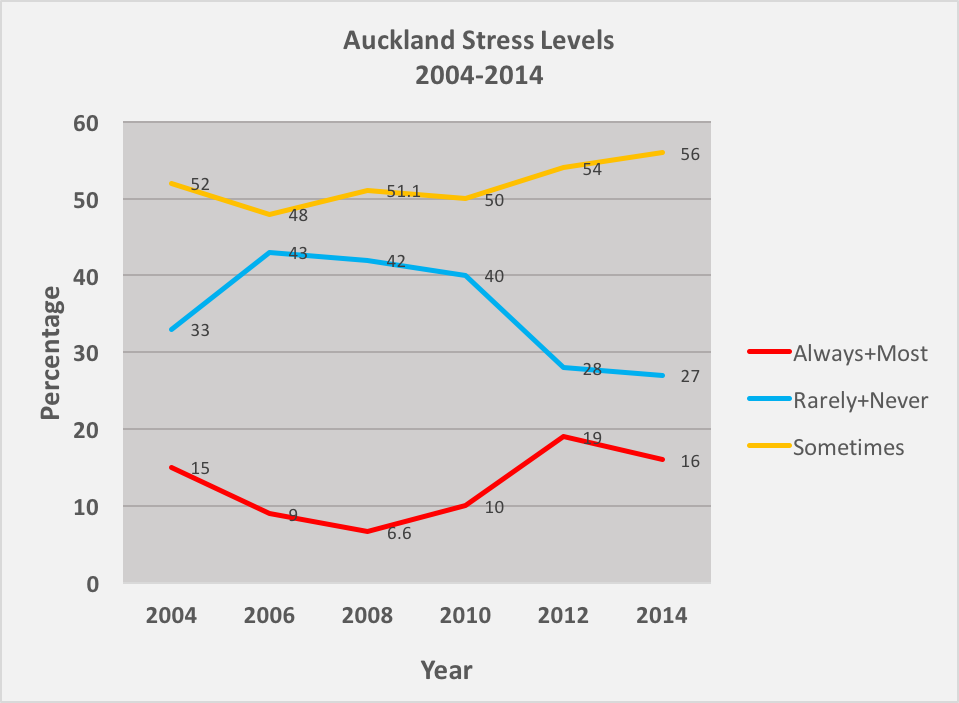
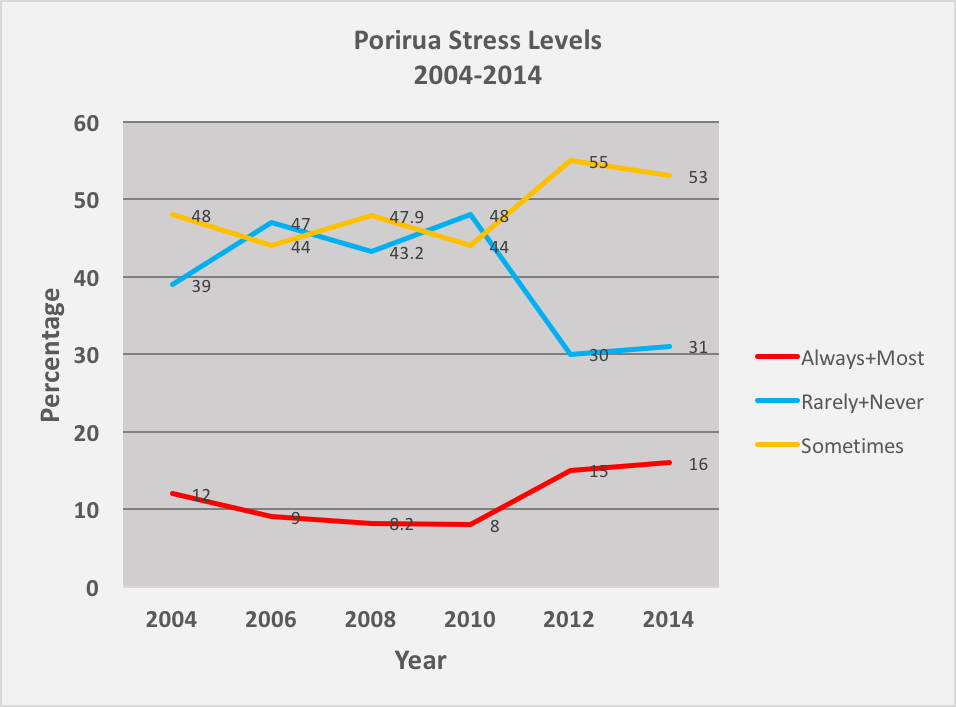
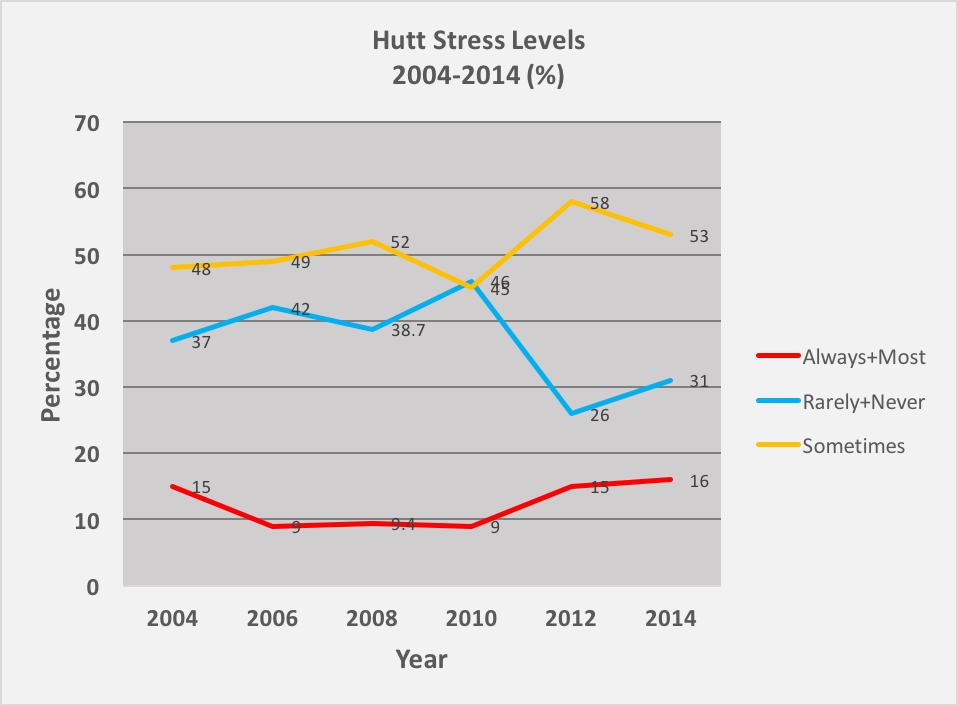
That ‘first impression’ is borne out when each city is looked at separately. If you thought Christchurch was the cause of the overall increase in 2012 and 2014 then that doesn’t seem to be the case – it happens all over New Zealand (or at least in all of the cities).
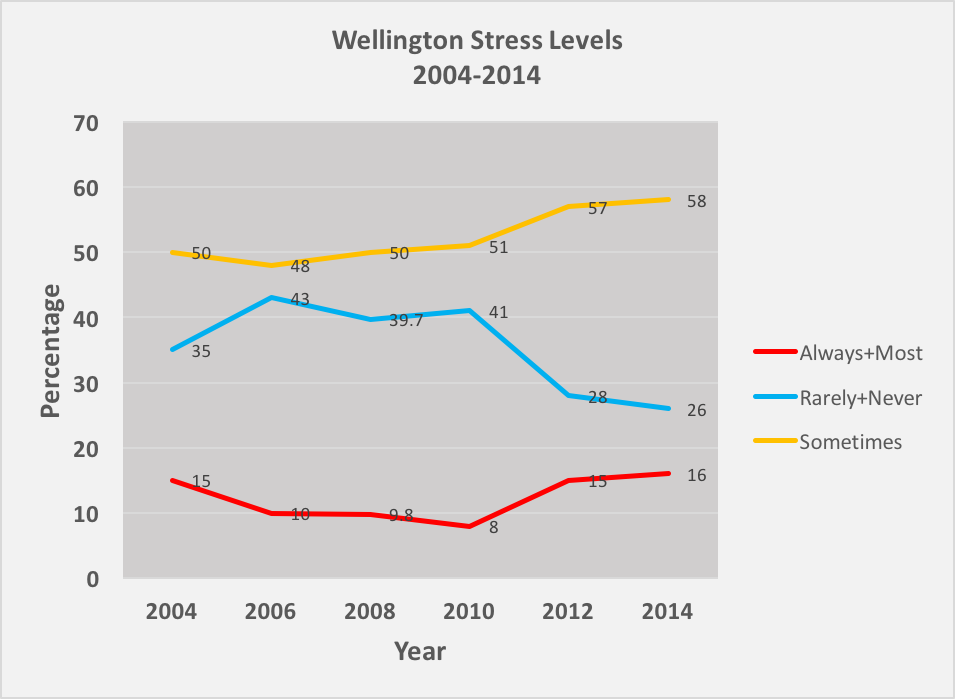
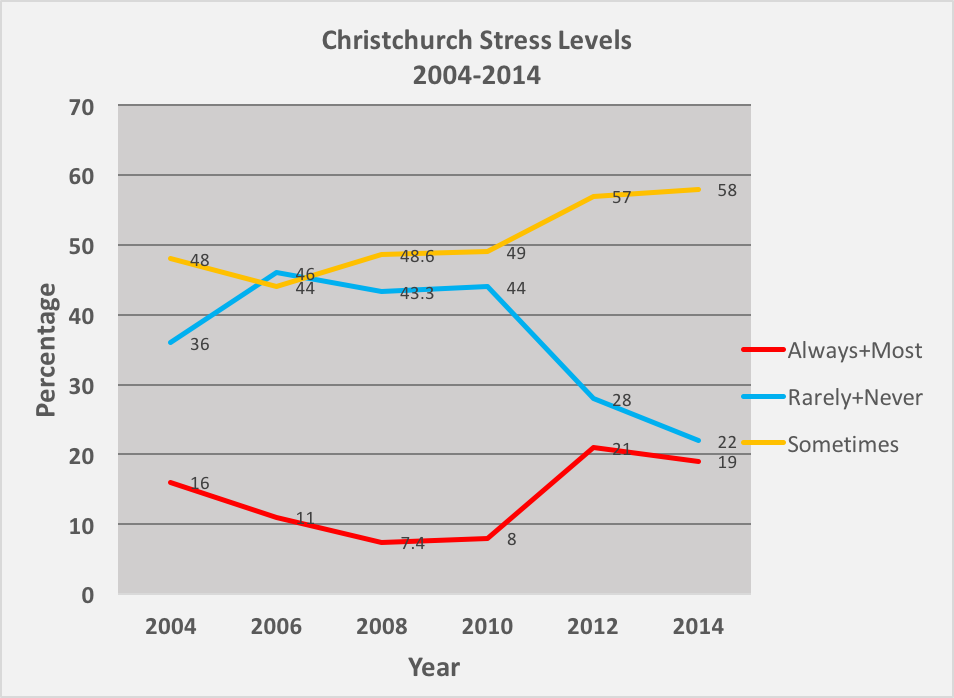
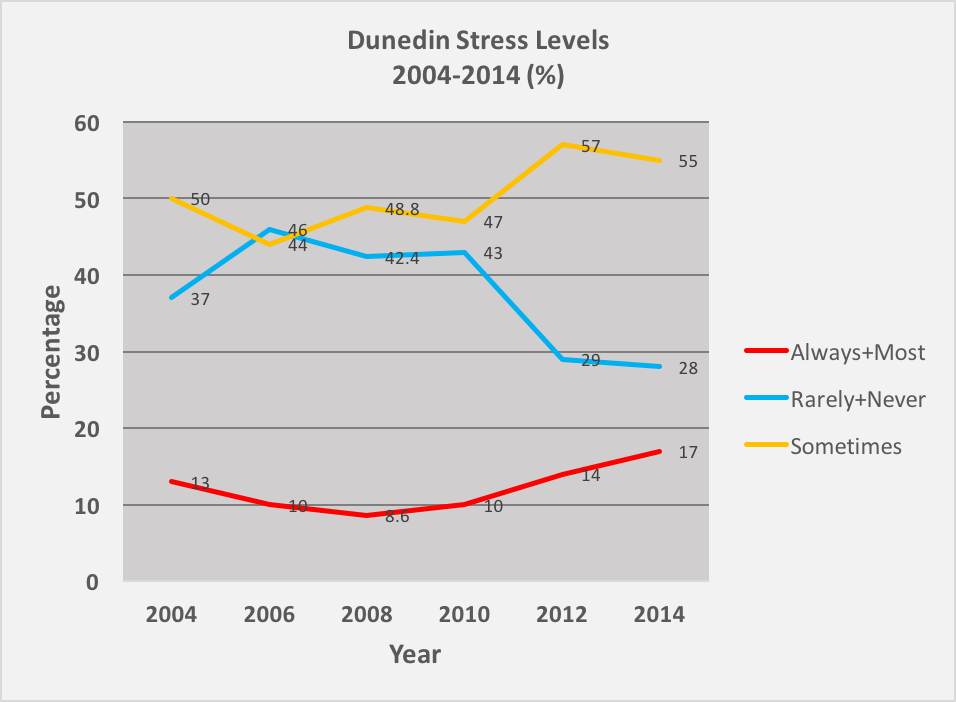
It’s true that Christchurch has the most marked decline in those who ‘Never’ or ‘Rarely’ experienced stress (only 22% in 2014) and the most marked increase in those who ‘Sometimes’ (58% in 2014) experienced stress and who experienced it either ‘Most of the time’ or ‘Always’ (21% in 2012) but other cities show the same general trends over the decade.
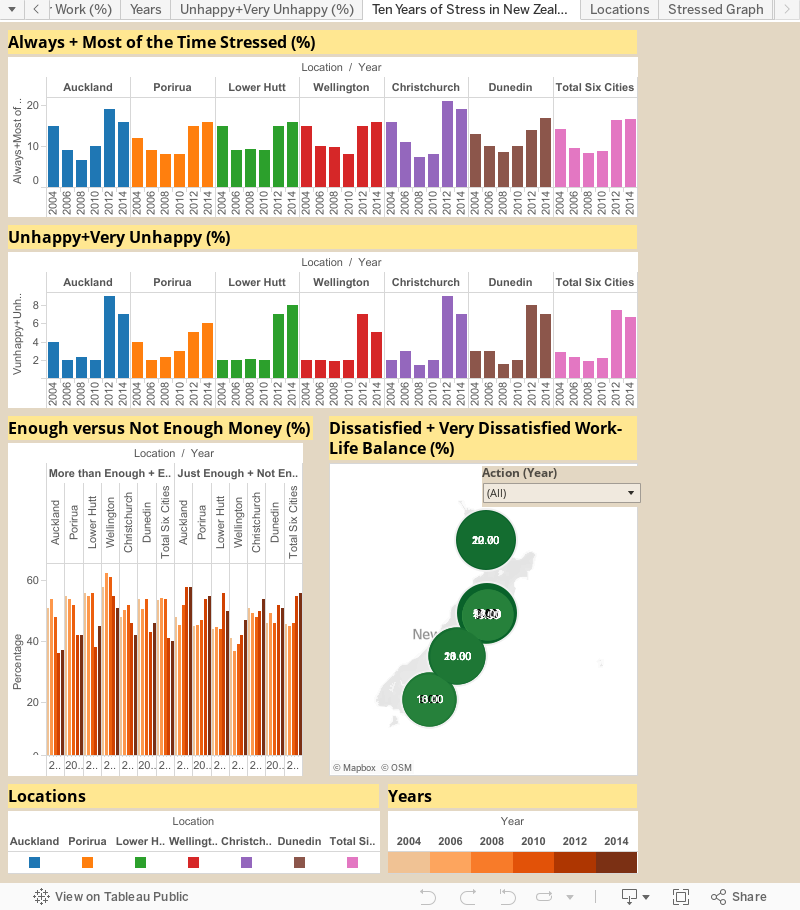
Answers to some other, presumably related, questions show the same patterns. The years 2012 and 2014 show marked increases in the percentage of people in the samples saying they are ‘Unhappy’ or ‘Very Unhappy’, who say they are ‘Dissatisfied’ or ‘Very Dissatisfied’ with their work-life balance, who say they have ‘Just enough’ or ‘Not enough’ money, etc..
Here’s a Tableau Dashboard of several of these measures combined. You should be able to click on either the year or location sheets to alter the information in the related sheets.
You should also be able to do it in combination – that is, clicking on ‘Wellington’ and on ‘2012’ should give you the information in the other sheets for that year in the Wellington sample. Other sheets might require scrolling and the map showing work-life balance dissatisfaction can be altered by year and by scale using its sliders. Hovering over bars in bar graphs, etc. will give you the raw numbers. Finally, you can download the data source.
From all of this it might seem that something important happened in the period 2010-2012.
Was it the effects of the Global Financial Crisis arriving at New Zealand’s shores?
Was it some consequence of the change in government in 2008?
Or, did the Canterbury earthquakes push everyone in New Zealand towards a more stressed mindset?
All of these are possible – but we’ll never know. And that’s not just because these apparent changes in population stress levels will only ever be correlational.
A more fundamental reason is this point noted in the 2014 Quality of Life Survey Technical Report (p. 7):
The same sequential mixed methodology that was employed in 2012 was used for this survey. Previously, a CATI methodology was used, but the approach was changed in 2012 to reduce costs, and to adopt a higher quality sampling frame.
…
Up until 2012, respondents were aged 15 years or older. From 2012 onwards, only those on the Electoral Roll were included, so all respondents were aged 18 and over.
In this method, all individuals on the Electoral Roll are eligible for selection (as opposed to just those who are successfully matched with a phone number – approximately 40% in the previous CATI surveys).
Changing from a CATI methodology to an online methodology means the time series of the Quality of Life Survey was broken in 2012. Therefore the results from this measure can only be directly compared to the results from 2012, as changes in the results may be due to the methodology changing rather than being a change in result overtime.
Yes, at the time the GFC hit, after the 2011 earthquake had struck (the 2010 survey was done after the September earthquake but before the 2011 earthquake) and shortly after a change in government the survey method was radically changed. Unfortunate.
It means that any longitudinal ‘trend’ or change may just be a methodological artefact.
It’s not that the data definitely don’t indicate a change in the real phenomena the surveys measure over the decade (e.g., in this case, levels of stress). They might. But, then again, they might not.
The problem is that it is impossible to know whether or not the different results between the 2012 and 2014 surveys and the previous ones are a product of methodological changes or represent actual changes in what the surveys are looking at.
Worse still, it could very well be that for some measures – and for some places such as Christchurch – the changes in the numbers arise from both sources; the change in method AND the change in the actual phenomenon.
It’s unlikely, for example, that Christchurch people did not change their levels of stress between the 2010 survey and the subsequent ones. In fact, all the other information we have on mental health and the CERA wellbeing surveys suggest a significant change in levels of stress, anxiety, depression, suicides, etc. as linked to above.
In fact, the CERA surveys (conducted six monthly) specifically ask about stress in much the same terms as the Quality of Life Survey. The latest CERA wellbeing survey findings mirror the 2014 Quality of Life Survey findings almost exactly:
Stress and stressors
- Levels of stress remained largely steady. 73 per cent experienced stress at least sometimes in the past 12 months. This is the same as in September 2014 [roughly when the Quality of Life Survey was conducted] and down from 75 per cent in April 2015.
- The proportion of people feeling frequent stress is also steady. 20 per cent report feeling stressed “always” or “most of the time”, compared with 21 per cent in September 2014 and 19 per cent in April 2015.
A reasonable assumption, then, would be that the 2012 and 2014 Quality of Life surveys were relatively accurate measures of stress in the populations surveyed (at least compared with the surveys in previous years). Certainly, responses levels were higher and as was quoted, the method was chosen because it was likely to produce a “high quality sample“.
Interesting conclusions follow from that assumption about the relative accuracy of the 2012 and 2014 surveys.
First, if all differences between the 2004-2010 surveys and the 2012 and 2014 surveys are down to a change to a more accurate methodology (e.g., more representative sample) then it seems that the earlier surveys were systematically under-reporting levels of stress in our society. (I haven’t got space to go into it here but the earlier surveys were disproportionately responded to by older, female and higher income groups to an extent that was greater than the same over-representation in the 2012 and 2014 surveys.)
However, if it is also assumed, as argued above, that Christchurch residents are – at the population level – significantly more stressed now than they were prior to the earthquakes then surely a good part of the change in reported levels of stress (for Christchurch at least) between 2010 and 2012 is actually from the earthquakes.
Yet, if that is the case then changes of similar magnitudes in reported stress levels in other cities between the 2004-2010 surveys and the 2012 and 2014 surveys are presumably also caused by something other than a change in methodology.
Second, there are interesting implications concerning how people respond socially to questions about stress, hardship, happiness and the like. A CATI method (used in the 2004-2010 surveys) involves directly talking to someone over the telephone. Completion of an online survey (used in the 2012 and 2014 surveys), by contrast, is impersonal (i.e., less directly a social interaction).
It may well be that in speaking to others (even telephone interviewers) we will have a tendency to claim that we are doing better than we are. Admitting to what may be perceived as a weakness (feeling stressed, feeling unhappy, not being able to maintain good work-life balance, etc.) directly to another human being is not easy. It may well seem easier to do so in an anonymous online survey.
Yet, even with an online survey we are still ‘talking’ to ourselves, at a minimum. That is, if anything we may even under-report our actual levels of stress, etc. when completing a survey anonymously for the simple reason that we then have to deal with having given that answer (e.g., admitting to ourselves that we are always stressed).
Third, if the second point, above, is valid then it may be that some questions (e.g., about reported wellbeing) will show the effect of the change in method more than other questions (e.g., about satisfaction with council services).
If the effects of that change (seemingly to greater accuracy through better representativeness and larger sample size) were then extrapolated then it may well be that the trend to the reporting of greater levels of stress would also continue to increase. That is, those who did not respond even in the 2012 and 2014 surveys (some 73% in the 2014 survey – see p. 24 of the 2014 Quality of Life Survey Technical Report) may not have responded partly because of having higher levels of stress, depression, etc. (e.g., feeling too ‘hassled’ to bother).
Fourth, the change in method was apparently done in an effort to reduce costs – which may be why only the large, remaining councils opted in. (Others previously involved included Tauranga and Hamilton and there were also samples taken from outside the participating councils – a ‘Rest of New Zealand’ sample. Further, the sample sizes were larger.)
By ‘costs’ I presume what is meant is the financial funding of the surveys. If so, then this is a good example of how the squeeze on public funding affects what research can tell us about our society. Certainly, it may well be that more accurate measures are available, in this case, through a cheaper survey method. But, at the very least, the longitudinal dataset is potentially broken (or highly uncertain) so trends become very difficult to identify.
As this example of surveys of stress levels shows dramatically, just when you may want to know the effect of environmental factors such as the GFC, the earthquakes and changes in government (and policy) a cost-motivated change in method can scupper your chances of ever knowing.
In fact, methodological change is only one aspect of how economic and political factors constantly change the ground under the feet of any researcher who wants to provide information for public debate.
For example, during the period 2004-2014 not only did the number of councils reduce through attrition (i.e., some councils such as Hamilton and Tauranga no longer participated perhaps because ‘social wellbeing’ ceased to be a ‘core function’ of councils) but also the councils themselves were restructured. This was, of course, most evident in the amalgamation of Auckland councils into the ‘super city’.
I confess that I did not ‘clean’ the data (graphed above) to take account of that amalgamation – though I could have. That means that, since the legislation was passed in late 2010 to amalgamate the previous seven city and district councils, ‘Auckland’ became not just the Auckland City Council area but the area previously covered by all seven authorities. The figures for Auckland in the 2004-2010 surveys therefore do not cover the same area as those in 2012 and 2014.
All in all it turns out that it is quite stressful trying to interpret what longitudinal data we have on stress levels in New Zealand – and, to continue to pun, its hard to know what to stress about what we know about those stress levels.
That’s a pity for all sorts of reasons, not least that we now know that chronic stress is one of the most pervasive factors in so many health issues.
We also know, as this documentary brilliantly illustrates, that stress is intimately associated with social structures:
Well worth a watch.
Putting aside all of this (reasoned) speculation, there’s an even bigger issue behind all of this interest in wellbeing.
It is becoming increasingly de rigeur to measure quality of life, wellbeing, happiness, life satisfaction and the like. Why?
The easy answer is that we are now, thankfully, more concerned about the quality of people’s experiences of their social, economic and environmental contexts. That is, an interest in wellbeing is ‘a good thing’.
The more complicated answer places the omnipresence of a concern over wellbeing into a broader, more critical, social and economic context.
For now, I’ll simply point to a couple of books I’ve read recently. Their titles give you a sense of the ‘backlash’ they represent.
‘The Happiness Industry: How the government and big business sold us well-being‘ by William Davies.
‘Do What You Love: And other lies about success and happiness‘ by Miya Tokumitsu.
But that topic is one for later …