
We live in ‘interesting times’ – as the mythical ‘Chinese curse’ understatedly put it.
It’s almost unbearably ‘interesting. From environmental catastrophe gathering its inevitable head of steam to global ructions in the political world and outright wars in the geopolitical world there’s more than enough interest to go around.
But it’s more than interesting.
It also has a feeling of entering into the dark. In more ways than one.
Perhaps the most interesting part of these interesting times, though, is that it was – almost – predicted some years ago by none other than U.S. intelligence as the International Forum on Globalisation position statement notes:
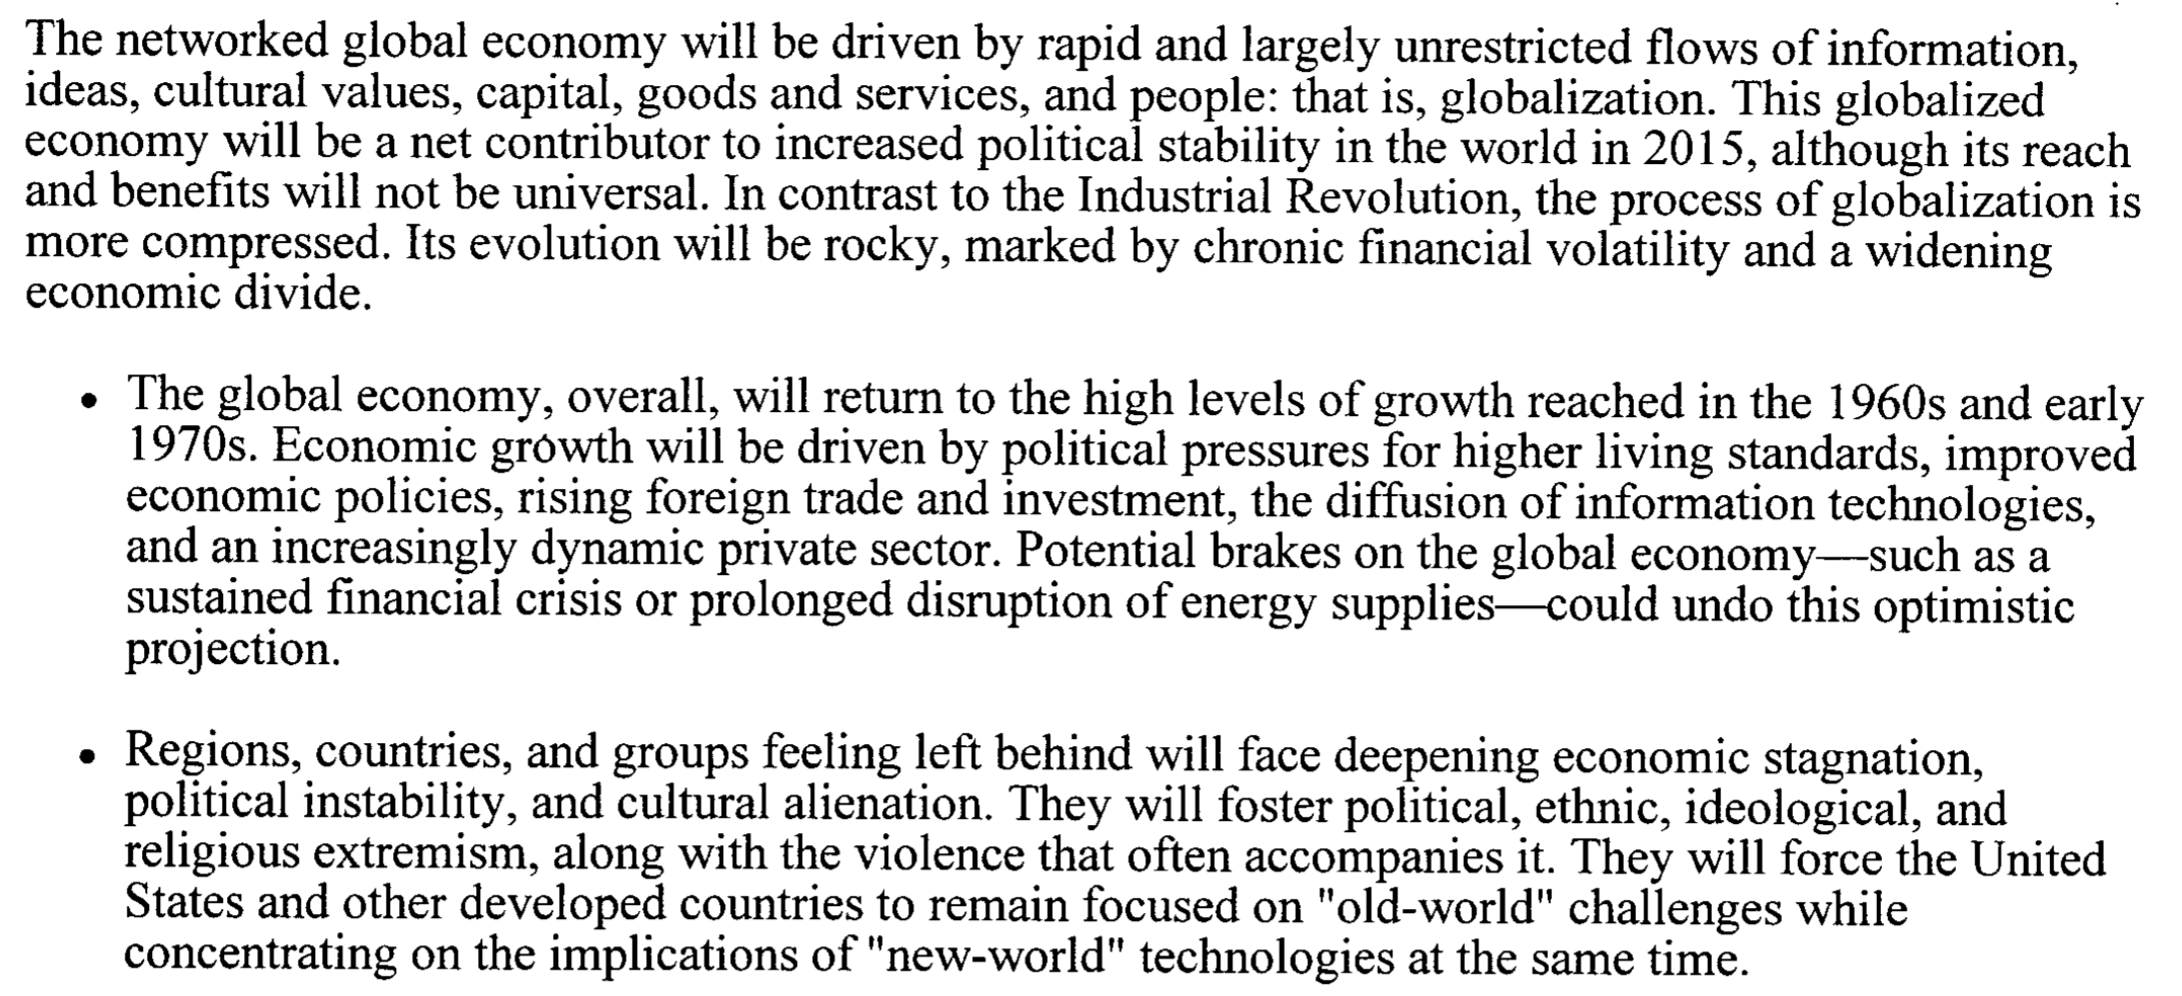
In its Global Trends 2015 report, issued in 2000, the CIA maintained that globalization will create “an even wider gap between regional winners and losers than exists today. [Globalization’s] evolution will be rocky, marked by chronic volatility and a widening economic divide…deepening economic stagnation, political instability, and cultural alienation. [It] will foster political, ethnic, ideological, and religious extremism, along with the violence that often accompanies it.”
From the original PDF of the Global Trends 2015 Report is the fuller prediction about ‘The Global Economy and Globalisation’ (pp. 6-7):
Global Trends 2015 at http://www.foia.cia.gov/sites/default/files/document_conversions/89801/DOC_0000516933.pdf
Back then, it was assumed that most of the volatility would be at the ‘periphery’, in the ‘developing’ world. It was also assumed that the global economy would return to 1960s levels of growth excepting a prescient condition that something like a “sustained financial crisis” might “undo this optimistic projection“.
The expectation was also that “This globalized economy will be a net contributor to increased political stability in the world in 2015, although its reach and benefits will not be universal.”
Hindsight might not be a fine thing but it is telling.
It seems now that times are also ‘interesting’ in the heart of the developed world, even at its very epicentre – the Western Anglosphere of the United States and the United Kingdom. The “increased political stability” may be somewhere but not, at present, in these places.
Take, for example, the forthcoming presidential elections in the United States.
Clinton versus Trump – A black and white decision?
Plenty has been written about the attributes of the two – now fully coronated – presidential candidates in the United States.
For many on the left and even for many on the right – at least in New Zealand – the choice is now quite black and white: Clinton is the sane person’s choice.
Why, then, has Trump managed to get to where he is? Are his supporters insane?
One overarching explanation that has been repeated in commentary is that the white working class – especially men – have been ‘left behind’ economically over the last thirty or so years.
In this post I want to highlight some trends in poverty in the United States that may shed light on Trump’s appeal to at least some of those low income whites and, also, part of what might be behind the enduring loyalty of African Americans to the Clinton ‘brand’.
These trends don’t provide ‘the explanation’ for Trump’s rise. But they’re signposts along the path to an explanation.
To understand why political radicalisation in the U.S. has fallen as it has in terms of demographics it’s first necessary to look closely at the pre-existing ‘bruise’ upon which the blow of the GFC fell. Which groups, to put it starkly, were most bruised by the neoliberal policies of the last 30 or 40 years in the U.S.?
The answer from the data is surprising.
The data that form the basis for the following graphs come from the U.S. Census figures over the past five or six decades.
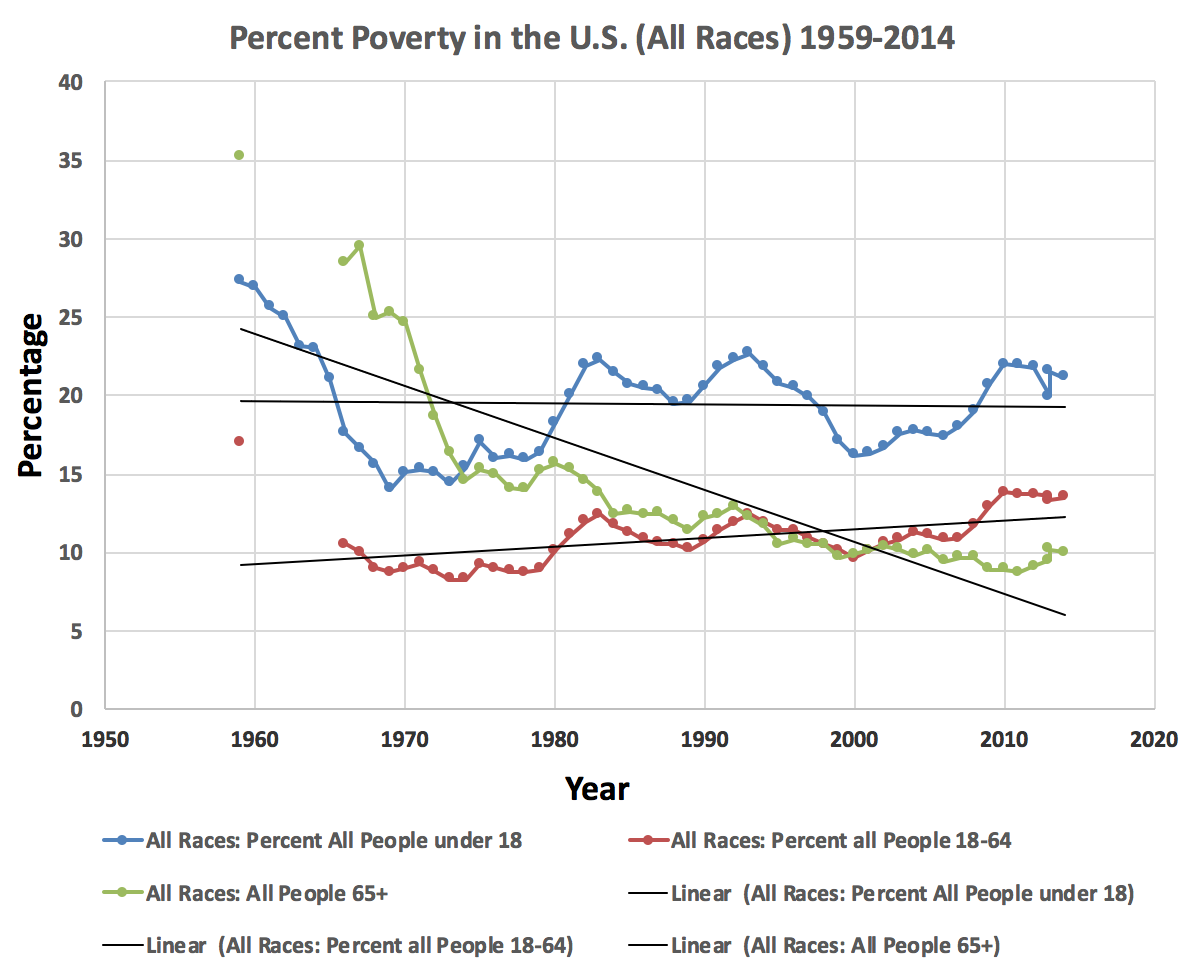
The first graph shows poverty levels in three age groups for the U.S. population from 1959 to 2014.
Source for Data: https://www.census.gov/data/tables/time-series/demo/income-poverty/historical-poverty-people.html (See Table 3: Poverty Status of People, by Age, Race, and Hispanic Origin
The poor may always be with us but the different trends for different groups are revealing.
One striking feature of this graph is the dramatic decline in those below the poverty level in the over 65 years age group. In 1959 the rate of poverty for this group stood at 35.2 percent which was then greater than that for those under 18 (27.3 percent) and those between 18 and 64 years (17.2 percent). By 1974 it had dropped rapidly to 14.6 percent which was just below the rate for those under 18 (15.4 percent). The poverty rate continued on a steady decline, barely halted even by the GFC, with the rate at 10.0 percent by 2014.
Given improvements in access to benefits for the elderly over this time (e.g., Medicare established in 1966) and also the increasing – and reliable – voter pool in this age group this trend may well be testament to welfare’s efficacy at fighting poverty (the same has been true in New Zealand with New Zealand Superannuation).
The worst affected age group since the mid-1970s has been those under 18 years of age. Going back even further, some 27.3 percent of that age group were below the poverty level in 1959. By 2014, after the Global Financial Crisis (GFC) it was still at 21.1 percent. Since the low in the mid-1970s there has also been a marked increase, returning to levels of poverty last seen in the mid-1960s. But, of course, those under 18 don’t vote; and they are often dependent children of adults in poverty.
Those aged 18-64 years (essentially working-age) had 10.5 percent below the poverty level in 1966 (17.0% in 1959, the first year that data were available) and in 2007, just before the GFC were at 10.9 percent climbing to 13.8 percent in 2010 and still at 13.5 percent in 2014. Compared to the low of 8.3 percent in 1973 and 1974 there has been about a 63 percent increase in the poverty rate in this age group.
There are now higher rates of poverty in the working age group than in those over 65.
But t’s when this national picture is broken down by race that the really interesting trends emerge.
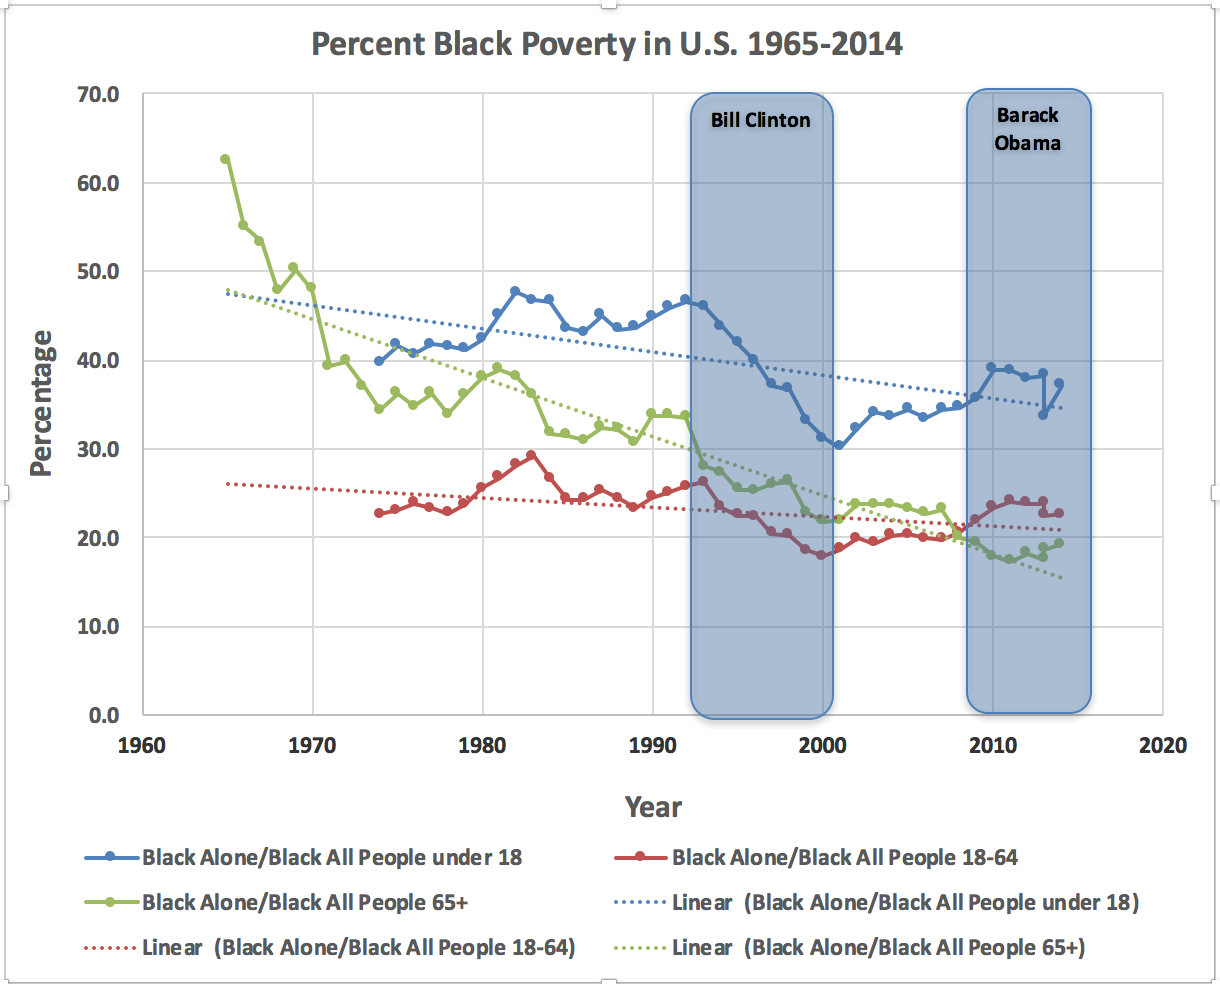
Here’s the graph of poverty levels amongst ‘Blacks’ in the U.S. between 1965 and 2014. (I’ve added overlays of the Presidencies of Bill Clinton and Barack Obama.)
Source for Data: https://www.census.gov/data/tables/time-series/demo/income-poverty/historical-poverty-people.html (See Table 3: Poverty Status of People, by Age, Race, and Hispanic Origin
The most striking feature of the graph is that the rates of poverty for all three age groups are, and have been, substantially higher than for the national average. For example, in 2014 while the national rate of people aged under 18 below the poverty level was 21.1 percent it was 37.1 percent for Blacks in this age group (a rate about 76 percent greater).
Despite the high levels of poverty overall it is noticeable, once again, that there has been a major decline in levels of poverty in the 65+ age group. It declined precipitously from 62.5 percent in 1965 to ‘only’ 17.3 percent in 2011 and then slightly higher in 2014 (19.2 percent). The 2014 rate, that is, was less than a third of the rate in 1965 for this age group.
What, however, is perhaps the most surprising finding in these data is that rates in the other two age groups have also declined – though nowhere near as markedly. And that is despite nearly 40 years of ‘Reaganomics’ and its successors.
Blacks aged under 18, for example, have poverty levels today that are still (very marginally) less than the rates in the mid-1970s – and that’s in the wake of the GFC. Even more surprising, perhaps, is that those Blacks aged 18-64 also have rates no higher than those in the 1970s (despite the GFC) and considerably better than the rates during the 1980s and early 1990s. Astonishingly, the decline has been downwards, overall.
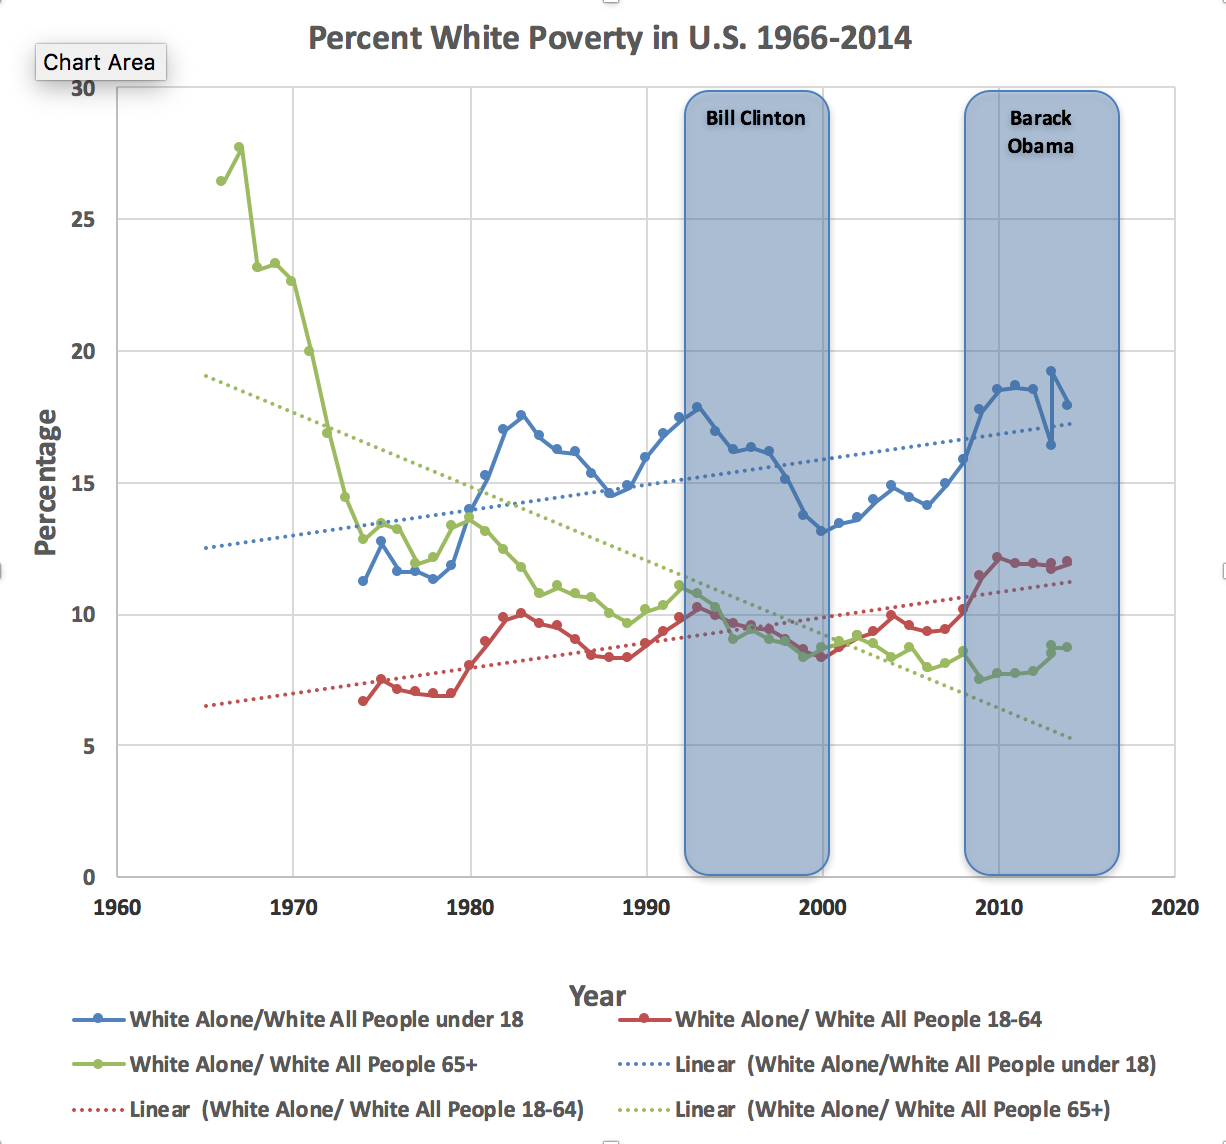
Now here’s the graph for ‘Whites’.
Source for Data: https://www.census.gov/data/tables/time-series/demo/income-poverty/historical-poverty-people.html (See Table 3: Poverty Status of People, by Age, Race, and Hispanic Origin
While those over 65 had the now familiar pattern of decline over time there is a worsening trend for the two other age groups. Those Whites under 18 went from a rate of 11.2% in 1974 to 17.9% in 2014 (an increase in the poverty rate of 59.8%). Whites of working age population (18-64) had a poverty rate that increased from 6.6% in 1974 to 11.9% in 2014 (an increase in the poverty rate of 80.3%).
There is, however, a caveat to do with the ‘race’ categories used in the U.S. Census. ‘White’ (or ‘White Alone’) can include those of Hispanic origin since Hispanic origin refers to nation of origin and not to race (some ‘Blacks’ may also be Hispanic).
Fortunately, the Censuses did collect specific information that allows differentiation of those of ‘Hispanic Origin’. Taken as a category, then, the poverty rates for ‘Hispanics’ can be presented:
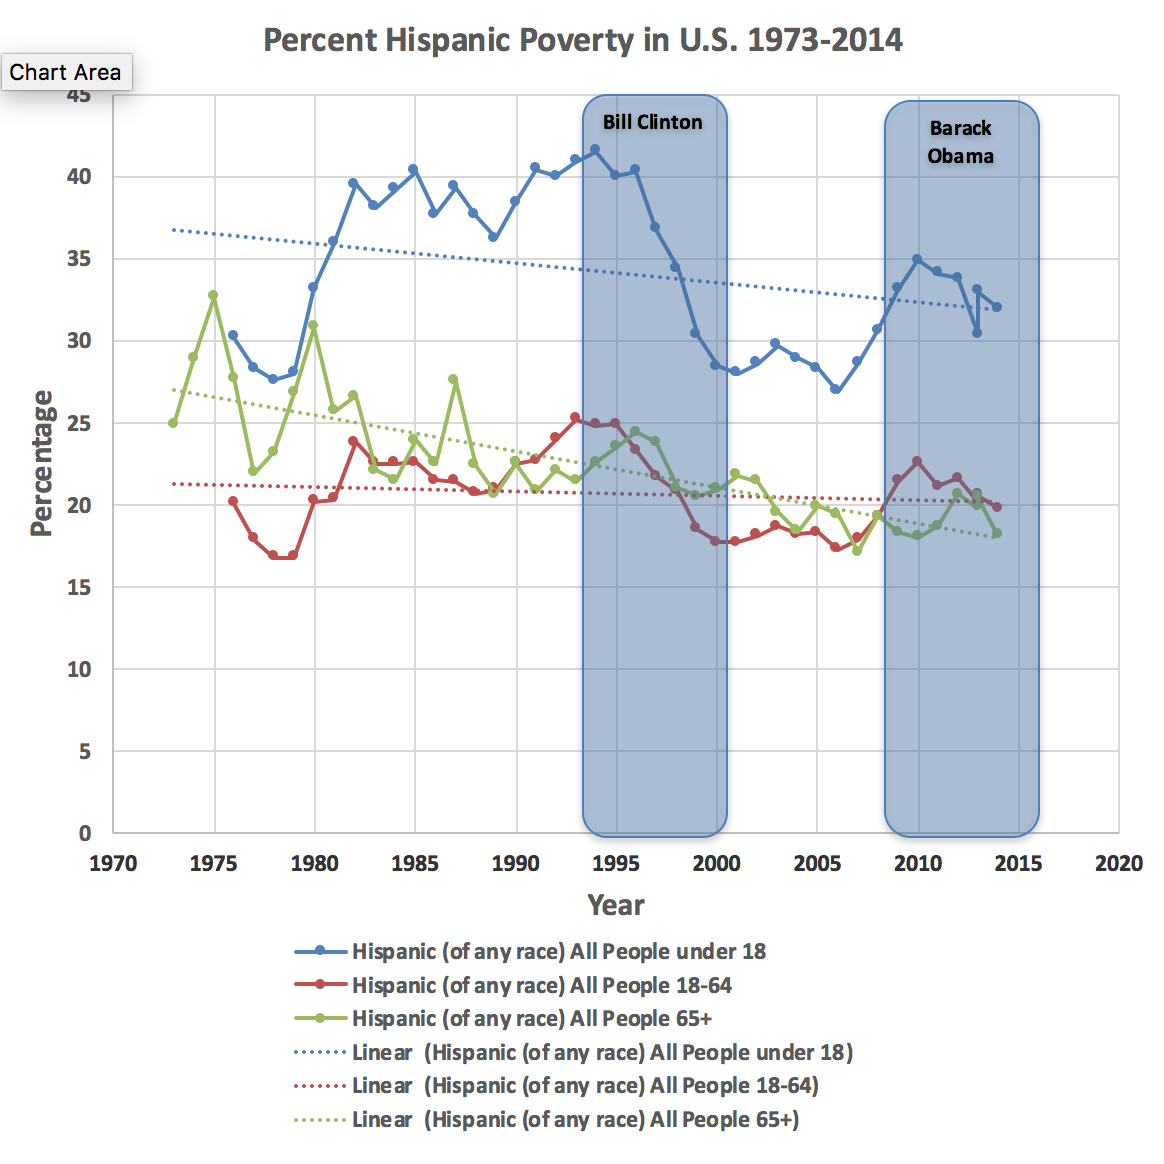
Source for Data: https://www.census.gov/data/tables/time-series/demo/income-poverty/historical-poverty-people.html (See Table 3: Poverty Status of People, by Age, Race, and Hispanic Origin
Poverty rates are, overall, high for this group – on a par with those of ‘Blacks’. But, once again, for all age groups there has been either a decline or no increase in poverty rates (and this despite a rapid population increase for this group over the period, presumably fuelled by immigration).
And – just as with the data for Black rates of poverty – even after the GFC rates of poverty have not reached the peak rates experienced in the early 1990s. For example, in 1993 poverty rates for the 18-64 years age group were 25.2% while, in 2014, it was ‘only’ 19.8% and had peaked at 22.6% in 2010 after the GFC.
The point is that the increase in the long-run rate of poverty in the previous graph showing poverty for ‘Whites’ has been despite the overall decline in Hispanic poverty rates during that period.
Finally, here’s the graph of poverty rates for the ‘White/Non-Hispanic’ group – the category that presumably most directly targets Whites understood as that part of the U.S. population that is not Black, Hispanic or Asian.
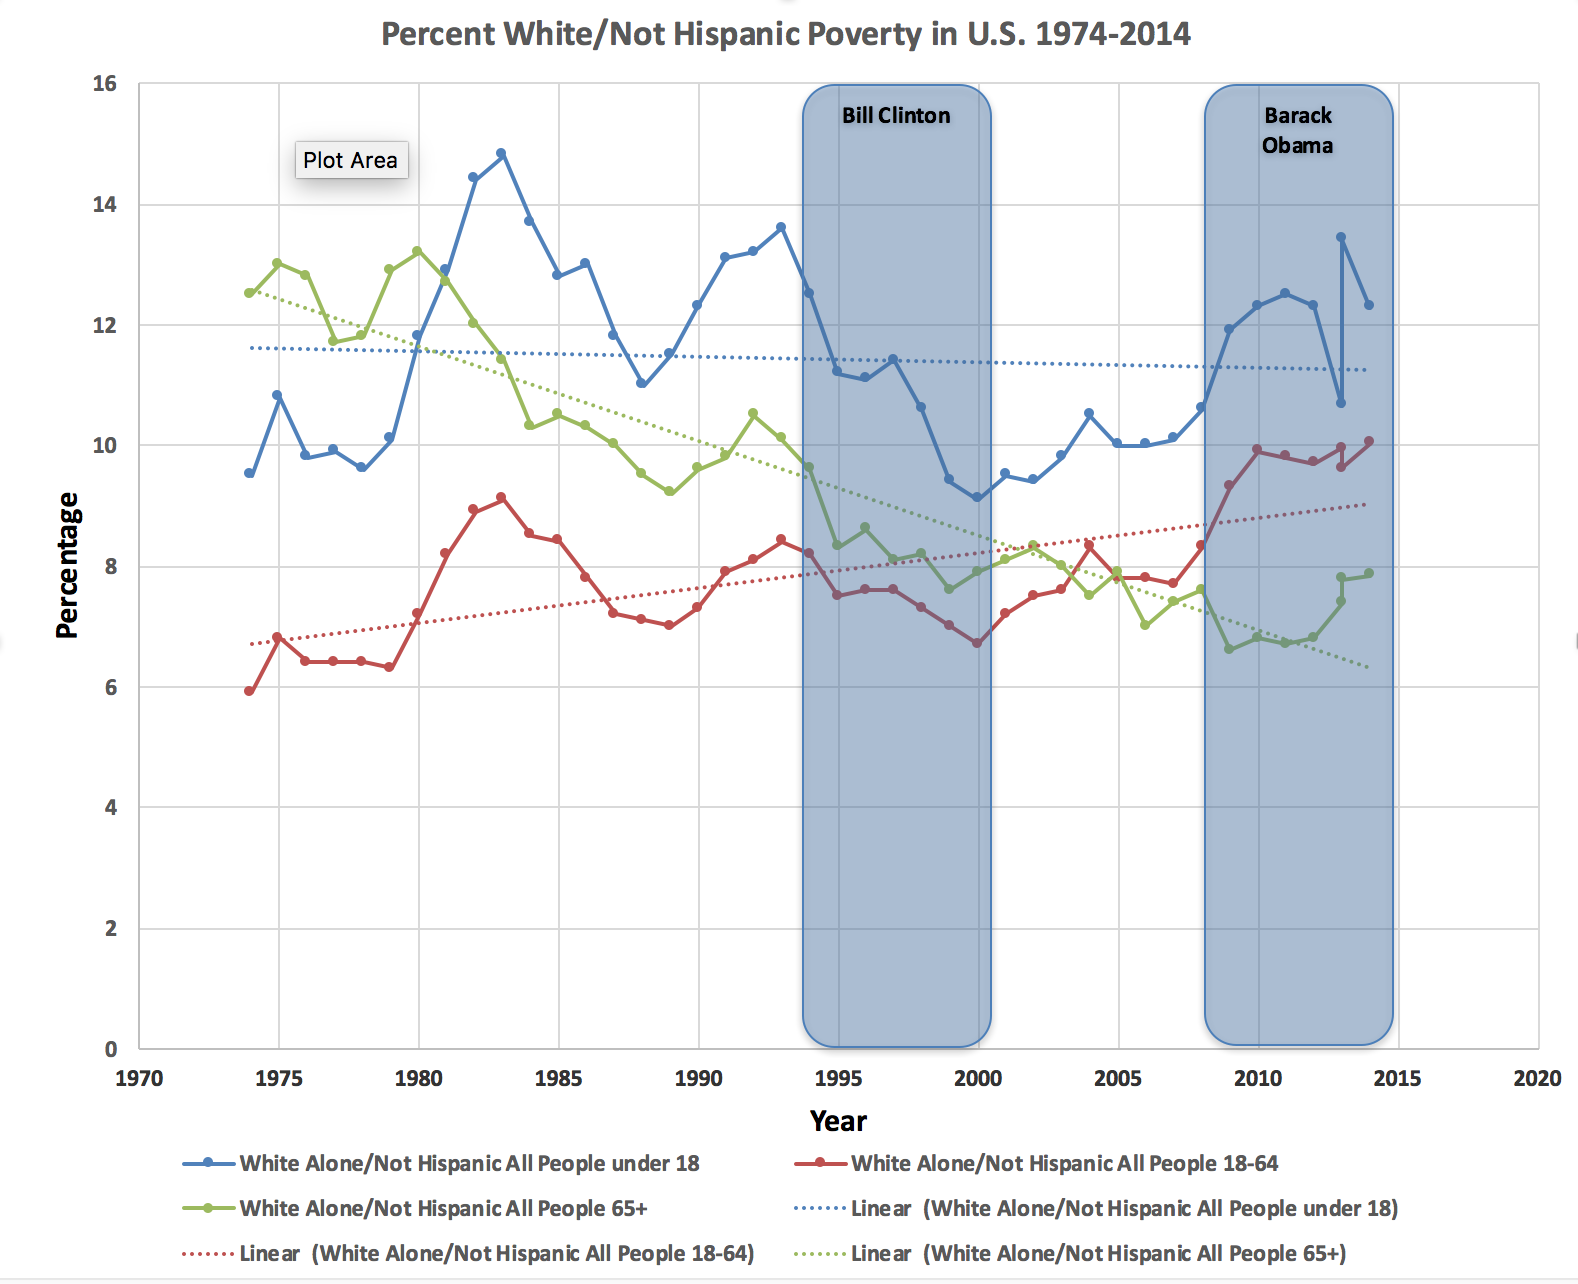
Source for Data: https://www.census.gov/data/tables/time-series/demo/income-poverty/historical-poverty-people.html (See Table 3: Poverty Status of People, by Age, Race, and Hispanic Origin)
For whites who are not hispanic the over 65 age group saw the same declining trend in poverty as every other group since the 1970s. For the under 18 group the picture is a little different. While the poverty rate for this age group peaked in the early 1980s and then declined, it rose again since 2000, more sharply after 2008. The trend line indicated on the graph is actually heading down but, between 1974 and 2014 the poverty rate has actually risen from 9.5% to 12.3%.
But the most striking feature – and the one trend that sets it apart from similar graphs of the other two racial groups – is the trend in the poverty level for those ‘not hispanic whites’ in the 18-64 age group. It is the only sub-group that has a trend line that has increased over that period. It rose from 5.9% in 1974 to 10.0% in 2014 (representing a 69.5% increase over that period). There was a particularly sharp rise as a result of the GFC and that rise has taken the poverty rate to unprecedented levels over the last 40 years.
In other words, it is non-hispanic whites aged 18-64 who stand out as the only group for whom the poverty rate has increased since ‘Reaganomics’ took hold in America. And it is this group for whom the consequences of the GFC have sent poverty to record levels in recent times. That is, many in this group have known little other than steady economic decline.
Simply, the GFC represented a massive ‘blow on a bruise’ for this group.
Taken as a whole, these data lead to several tempting conclusions. I don’t know if they are ultimately valid explanations but, at face value, they seem to help explain the support both for Donald Trump and for Hillary Clinton.
First, the high rates of poverty amongst ‘Blacks’ and ‘Hispanics’ have remained higher than the average rate of poverty throughout. But, they experienced marked declines especially during the 1990s. The 1990s broadly coincided with the presidency of Bill Clinton. If Blacks and Latinos, as electoral groups, show loyalty to the ‘Clinton’ brand that is quite in keeping with that aspect of the trend in poverty rates data.
In fact, the decline during the 1990s was so marked that even after the GFC rates have not returned to pre 1990s levels for either Blacks or Hispanics. That’s quite remarkable.
Second, the across the board massive reduction in poverty rates for the 65 and over age group during the past 40 years has meant that today’s older people in the U.S. were largely unaffected by the GFC. That Hillary Clinton has remained popular with older Democrat voters is, once again, in keeping with this trend. The appeal of Bernie Sanders would be minimal, presumably, for a group whose experience would suggest that the state of the economy and nation is not such that any ‘revolution’ is necessary.
Conversely, young people emerging on the cusp of the under 18 year age group and the working age group have certainly been impacted by the GFC. In fact, the worsening trend goes back further. There has been a steady increase in poverty rates for both of those groups since 2000.
On the assumption that rising poverty rates in a group reflect broader economic stresses for the group as a whole, it is perhaps no surprise that many young people have turned to Bernie Sanders during the Democratic primaries.
Third – and perhaps most pertinently – as many have argued, poor whites of working age have seen their conditions – and hence prospects – worsen progressively over the last 40 years, especially after the GFC. As a group they have been in steady economic decline over that entire period.
Of course, they are still at rates of poverty well below those experienced by working age Blacks and Hispanics but – politically – it is not always absolute levels of economic hardship that matter. After all, French peasants and urban poor had it extraordinarily hard for decades if not centuries prior to the revolutions in late 18th century France. As the Wikipedia entry summarises:
Following the Seven Years’ War and the American Revolutionary War, the French government was deeply in debt and attempted to restore its financial status through unpopular taxation schemes. Years of bad harvests leading up to the Revolution also inflamed popular resentment of the privileges enjoyed by the clergy and the aristocracy.
There’s poverty rates and then there’s changes in poverty rates. People, individually or collectively, can adapt to a ‘steady state’ even if it is a grim one. But we are set up, perceptually, to focus on change and to react to it. That’s what it is to be human – or any kind of animal. Change is where both threats and opportunities can be found so all animals are attuned to detect and respond to change.
If you really want to see an animal start to act more and more reflexively and aggressively then keep changing their environment for the worse.
At the level of human society nothing is surer than that worsening economic conditions generate more and more departures from the ‘acceptable norms’ of established behaviour, political behaviour included. From riots to protests to social movements and mass mobilisations – up to and including bloody revolution – the triggering cause is so often prolonged economic decline and the increasing fear, anxiety and aggression it generates.
The reverse is true as well. Optimism increases when economies are on the up-and-up.
In a 2013 study it was found that when a household has increasing prosperity the levels of reported ‘Subjective Well-Being’ (SWB) – understood as a mix of reported life evaluations, positive feelings and negative feelings – also increase.
The sample in the study was impressive. It involved “a subset of data from the 2005 to 2011 Gallup World Poll (GWP) administered to 838,154 individuals from 158 nations” (p. 269). Here’s a tabular summary of the findings:
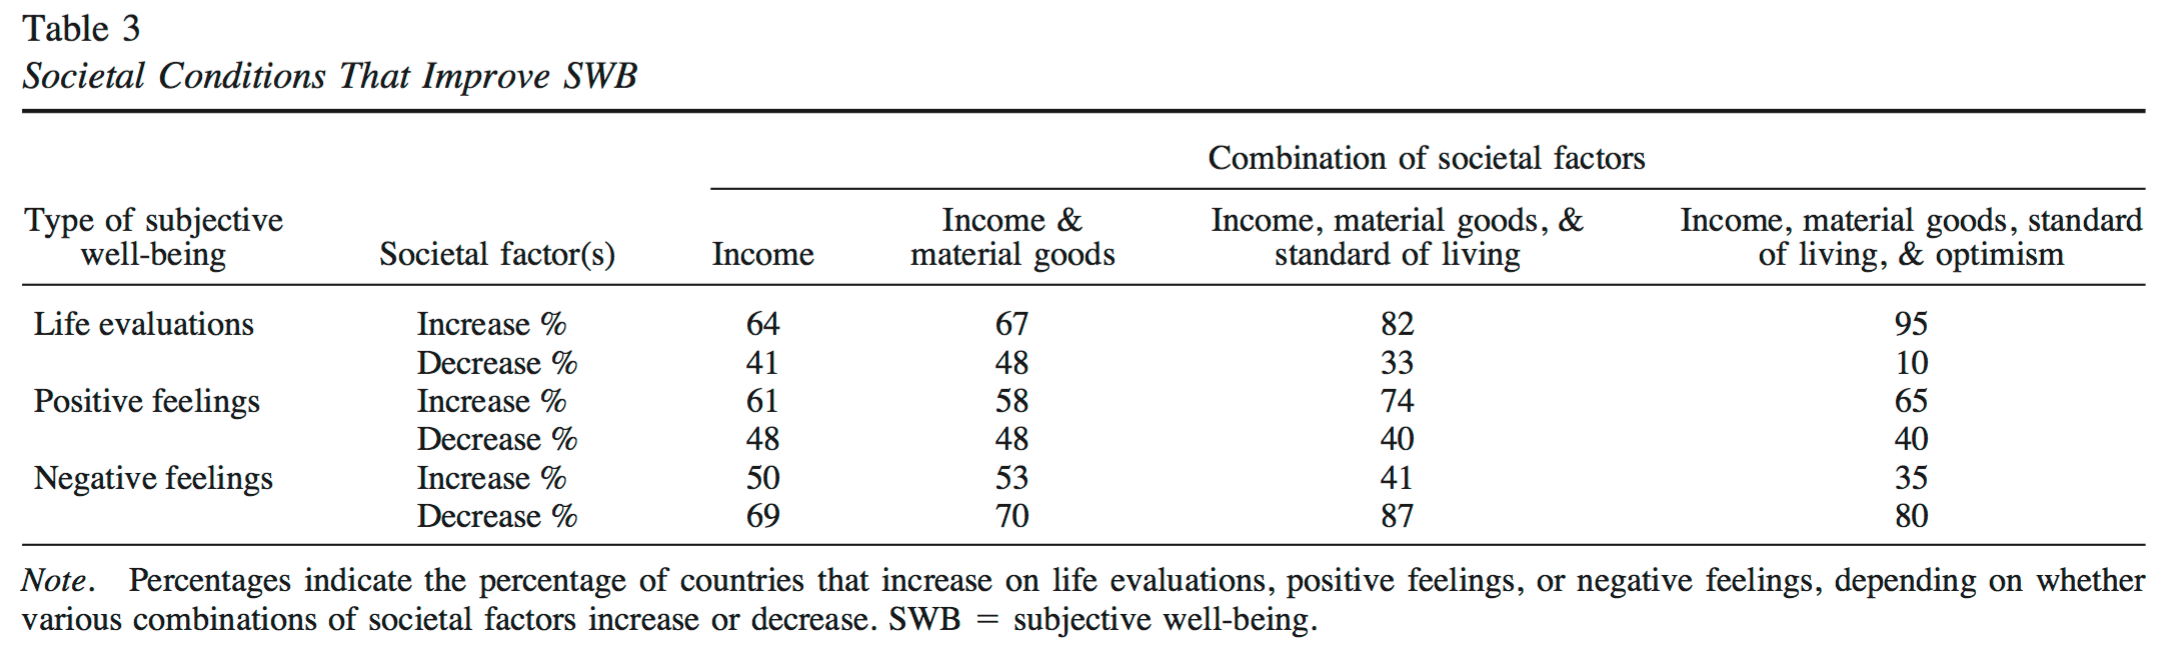
Source: Diener, Tay and Oishi (2013). Rising income and the Subjective Well-Being of nations. Journal of Personality and Social Psychology, 104(2): 267-276. From: https://www.apa.org/pubs/journals/releases/psp-104-2-267.pdf
When material conditions and optimism about future prospects go up so do feelings of well-being. Conversely, when they go down so do feelings of well-being.
To take a specific example, the right hand column in the table shows that when income and its ‘mediating variables’ (material goods, standard of living, optimism about future opportunity) all increased, then, in 95% of such countries life evaluations also went up. Conversely, when income and the three mediating factors all decreased life evaluations only went up in 10% of such countries. That is, in 90% of countries where these factors worsened, life evaluations also worsened.
The findings concerning levels of ‘positive feelings’ are less marked than for life evaluations but show the same correlation. More markedly, negative feelings increase in only 35% of countries that experience increases in income and the three mediating variables but increase in 80% of countries where those four variables are all decreasing.
Not surprising. But what’s the effect on people, beyond evaluating their lives more negatively and experiencing fewer positive feelings and more negative feelings?
It’s also known from the research that, at the level of the individual person, negative feelings generate a narrowing of focus and, consequently, a lack of opportunity to improve skills (emotional, cognitive, social, physical). When things are bad we hunker down.
An explanation for these interesting effects comes from Barbara Fredrickson’s ‘Broaden-and-Build Theory‘ of positive emotions:
I contrast this new model to traditional models based on specific action tendencies. Specific action tendencies work well to describe the form and function of negative emotions, and should be retained for models of this subset of emotions. Without loss of theoretical nuance, a specific action tendency can be re-described as the outcome of a psychological process that narrows a person’s momentary thought–action repertoire by calling to mind an urge to act in a particular way (e.g. escape, attack, expel). In a life-threatening situation, a narrowed thought–action repertoire promotes quick and decisive action that carries direct and immediate benefit: specific action tendencies called forth by negative emotions represent the sort of actions that worked best to save our ancestors’ lives and limbs in similar situations.
However, positive emotions seldom occur in life- threatening situations. As such, a psychological process that narrows a person’s momentary thought–action repertoire to promote quick and decisive action may not be needed. Instead, positive emotions have a complementary effect: relative to neutral states and routine action, positive emotions broaden peoples’ momentary thought–action repertoires, widening the array of the thoughts and actions that come to mind.
All of this suggests that when we experience negative emotions we narrow our focus, revert to decisive, unreflective responses just as we would in a situation of physical threat. By contrast, when we feel good we are more likely to be open to the world, new experiences, new people, etc.. That means we are then able to develop our skill-sets and ability to deal with future challenges. (Note: The paper linked to above is well worth a close read.)
Poverty – and its large penumbra of anxiety over falling into poverty – if it is anything, is a threat.
That’s because poverty is also grinding. It’s basically about not having the resources to operate in the society in which you find yourself.
That’s bad enough. But, as decline begins, as poverty worsens – as poverty rates increase – the threat is what looms large for many more people than those in poverty. As a threat it calls up the narrowed ‘thought-action repertoire’, etc..
That state of affairs is utterly terrifying. To have only ever experienced poverty is depressing; but to see it coming and to experience the loss of security and intensification of poverty is fearful.
So when material conditions are in decline ndividuals increasingly feel negative emotions (depression, anxiety, substance abuse climb). They then narrow their ‘thought-action repertoires’. They don’t broaden or build their skills (emotional, cognitive, social, etc.). They look at the future and see little chance of improvement so optimism declines. Everything about their situation makes them feel increasingly helpless.
In short, people increasingly lose hope. Their thinking turns negative along with their emotional state.
Then along comes Trump. And this is where it gets political.
But, first, there’s a further complication.
Any modern nation state – being a forced fabrication for the most part – is composed of multiple materially reproduced ‘cultures’ (or ‘sub-cultures’).
The same society, race or ethnicity can harbour within it multiple such cultures (hence ‘sub-cultures’), based around – and dependent upon – distinct material ways of life (e.g., farmers, factory workers, urban professionals, small business people, ‘tradies’, beneficiaries).
Large scale social and economic changes will, almost inevitably, have very different expressions in these different ‘cultures’. For some, a greater variety of cuisine and art, more interesting digital devices and exciting career options may be the most salient aspects of change; for others the most salient aspects could be loss of previously reliable jobs, communities that are dispersing and increasingly transient, and reduced political control.
These cultural stresses can then force expression politically. In fact, some analysis suggests that banking and financial crises such as the GFC predictably give rise to political partisanship and polarisation.
In an interesting piece, Amir Sufi reports work showing just this in the latest financial crisis (the ‘Global Financial Crisis’ – GFC – of 2008):
Our conclusion: financial crises tend to radicalize electorates. After a banking, currency, or debt crisis, our data indicate, the share of centrists or moderates in a country went down, while the share of left- or right-wing radicals went up in most cases.
What does this do to political decision making? Not surprisingly, we find, after almost any financial crisis, ruling governments became substantially weaker, while opposition coalitions grew stronger.
Crucial to this process of radicalisation, he argues, is the ‘debtor-creditor relationship’:
Every banking crisis is associated with excessive lending. In his masterpiece Manias, Panics, and Crashes: A History of Financial Crises, the great economic historian Charles P. Kindleberger finds that “asset price bubbles depend on the growth of credit.” As the bubble develops, borrowers who are less and less creditworthy take on more and more debt.
…
As Atif Mian and I documented in our 2014 book House of Debt, there was a big expansion in lending to marginal borrowers during this period. Astonishingly, mortgage-credit growth for home purchases and income growth became negativelycorrelated as the bubble developed, and many borrowers—even those in the middle class—used the rising value of their homes to extract equity and to finance consumption.
And, as is well known, the predominant response by governments around the world was to provide breaks (i.e., bailouts) to the creditors (banks) rather than the debtors (people). In the U.S. Sufi argues that the political partisanship reflected this divide between creditors and debtors: The Tea Party formed around the call to ensure that the ‘losers’ (i.e., the debtors with massive debt) would not receive any help while the ‘Occupy Wall Street’ movement organised in the interests of the debtors and against the bailouts received by the creditors (banks).
In relation to Europe’s political climate – especially Greece – Sufi further notes:
As a creditor nation, Germany (whose total exposure to a Greek default and exit from the euro could range from €61.5 billion to €84.5 billion, according to Der Spiegel) took the hardest line in debt negotiations, led by the strong-willed Chancellor Angela Merkel. Politicians in Germany directed their anger toward Greeks instead of toward the German banks that made poor lending decisions.
In a YouGov poll taken in July 2015, more than 60 percent of Germans (and 74 percent of Finns) said Greece should be held to the original terms of its loans, with no more bailouts. (The less-exposed public in France and Britain were more sympathetic to Greece and more open to renegotiating the terms of the loans, according to YouGov.)
Greek voters, by contrast, took a classic debtors’ stance and in 2015 elected the left-wing Syriza party, whose leader, Alexis Tsipras, called for repudiating some of Greece’s debt, reversing mandated spending cuts, and even leaving the euro.
As prime minister, Tsipras eventually capitulated and a deal was struck last July, but the political polarization has only deepened. The violently anti-immigrant, anti-EU, neo-Nazi Golden Dawn got 7 percent of the votes in last September’s general election, even though its leaders are facing criminal charges.
And;
This extreme polarization is in line with our conclusions and those of a subsequent paper by three German scholars who studied 800 elections in 20 countries between 1870 and 2014. Manuel Funke of the Free University Berlin, Moritz Schularick of the University of Bonn, and Christoph Trebesch of the University of Munich identified the extreme right (think Golden Dawn, or the National Front in France) as the principal political beneficiary of postcrisis partisanship. “Voters seem to be systematically lured by the political rhetoric of the far right, with its frequently nationalistic or xenophobic tendencies,” they write. Overall, they conclude, “the political effects [of banking and financial crises] are particularly disruptive.”
Turning back to the case of the United States presidential primaries, he concludes:
That’s certainly true here in the US as well, where Trump’s presidential campaign in particular exploits an underlying angst that the government is representing well-organized special interests at the general public’s expense. Ironically, much of the support for the Sanders campaign also reflects the same angst. This, rather than the classic debtor-creditor conflict that emerged with the Tea Party and the Occupy movement, is behind much of their backing. But the candidacies thrive in a hyperpartisan political environment that is the financial crisis’s true legacy. Trump and Sanders may be the indirect by-products of that crisis, but they are nonetheless its legitimate heirs.
As contexts go, I don’t think anyone would deny the importance of banking and financial crises of the magnitude recently experienced.
Trump, to date, has had the advantage that his rhetoric that America is broken and needs to be made ‘great’ again chimes with the economic decline experienced by whites.
Clinton has had the advantage that her rhetoric of steady improvement chimes with the overall experience of Blacks, Hispanics and older people in the past decades. In addition, she can thank the years that coincided with her husband’s earlier presidency for being a landmark in the improvements in poverty rates that meant that, even after the GFC, those groups remain better off today than they were in the 1980s and early 1990s.
Here’s a final couple of graphs that hint at another aspect of the ‘Black’ and ‘White’ nature of the appeal of the two presidential candidates:
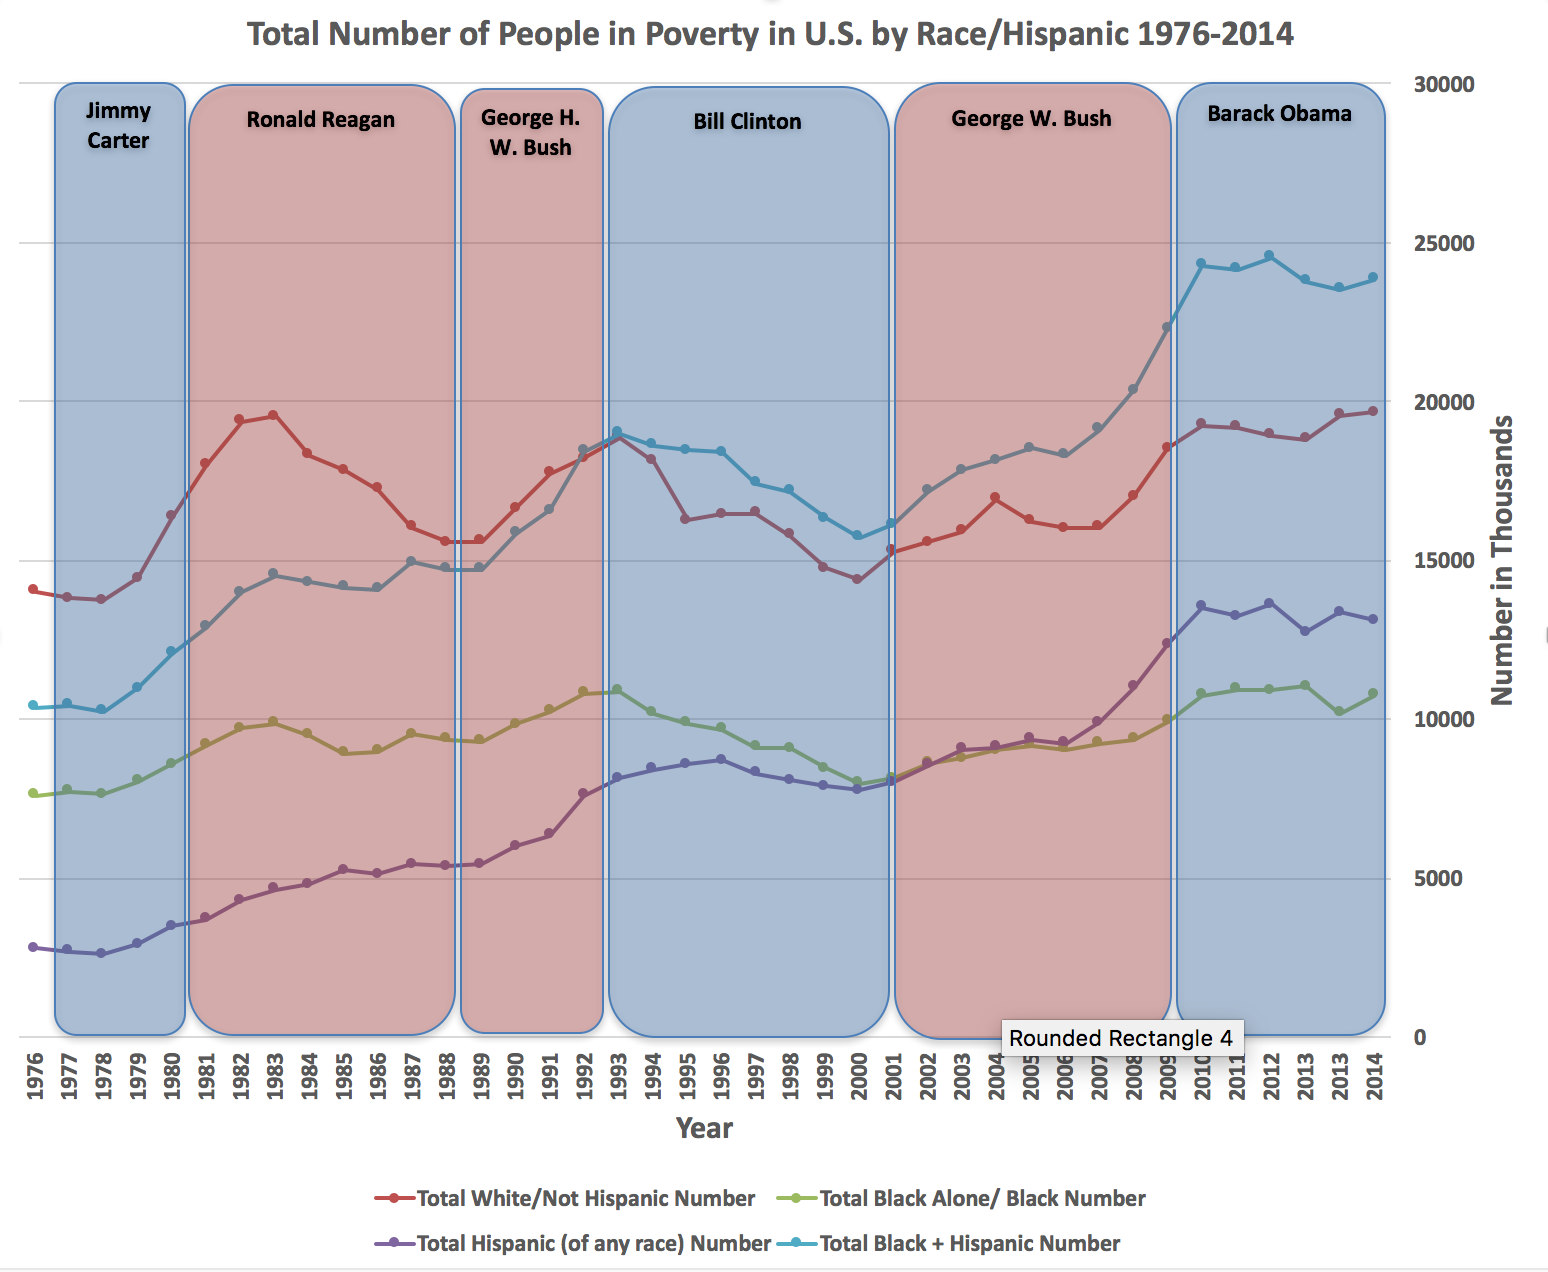
Source for Data: https://www.census.gov/data/tables/time-series/demo/income-poverty/historical-poverty-people.html (See Table 3: Poverty Status of People, by Age, Race, and Hispanic Origin
The total number of people of all ages in poverty in the United States has increased in all groups between 1976 and 2014. Two points stand out, though.
First, the only group for whom total numbers of people in poverty has consistently risen over that time is Hispanics. Both for Blacks and White/Not Hispanics numbers in poverty have increased but not as steadily. Presumably increased immigration is the cause of the rise in total number of Hispanics in poverty.
Second, if numbers of Blacks and Hispanics in poverty is combined (the light blue line) that total has exceeded the number of Whites/Not Hispanics in poverty since 1993 and, in 2014, was about 5 million more, in total.
Much of that ‘overtaking’ in absolute numbers has come from the marked increase in the immigration-fuelled increase in the number of Hispanic people in poverty. Within the space of 40 years the number of Hispanic people in the United States in poverty has gone from just under three million to now surpassing the number of Black people in poverty by over 2.25 million (total of over 13 million).
Here, however, is an electorally more significant graph:
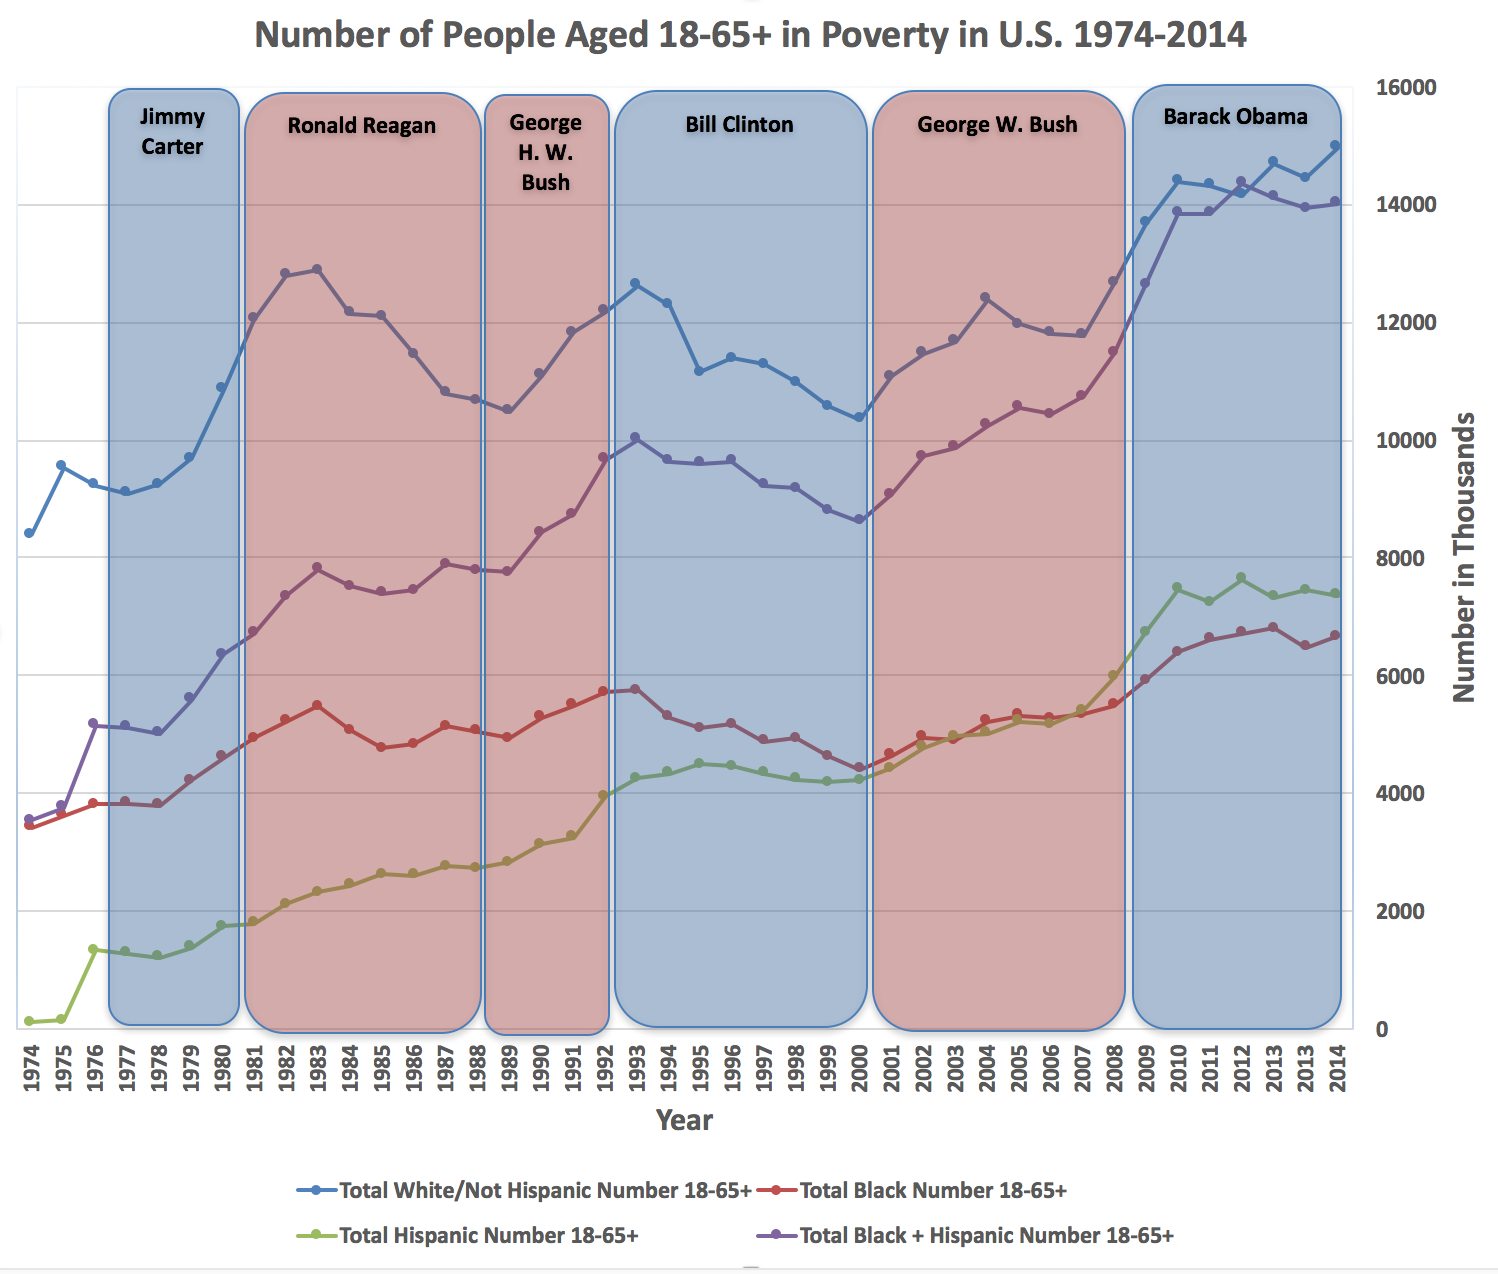
Source for Data: https://www.census.gov/data/tables/time-series/demo/income-poverty/historical-poverty-people.html (See Table 3: Poverty Status of People, by Age, Race, and Hispanic Origin
This shows the number of voting age people in poverty in the United States in each group. In this case, the total number of Whites/Not Hispanics in poverty exceeds the combined total of Blacks and Hispanics in poverty by roughly 1 million people.
Poor people tend not to vote compared with the better off. So it may be that these numbers can be discounted in electoral terms. But if these relative proportions in each group continue up the economic ladder so that people who feel economically ‘squeezed’ (but who are likelier to vote than those in poverty) then the White/Not Hispanic ‘angry’ vote would be a larger pool than the combined Black and Hispanic voting population.
Further, because rates of poverty are almost twice as high in Black and Hispanic communities than for Whites/Not Hispanics that means there are relatively fewer Black and Hispanic voters left in the ‘likelier to vote’ economic cohorts.
Economic hardship may be a ‘blunt instrument’ when it comes to explaining voting patterns. Nevertheless, the data above suggest it aligns with what is apparently the split between support for Trump and Clinton.
And ‘poverty’ and economic hardship are not, ultimately, just economic experiences. They affect individual experiences (what people think and feel) and, more importantly, they affect entire ways of life. They affect the very cultures we all depend upon to make our ways in the world.
It might not be in its ‘death throes’ but any culture that comes under pressure is likely to compensate and respond – at least at the margins – in ways that are not pretty to observe.
A functioning society would have responded to these pressures long ago. Instead it has tried to diminish, marginalise and ignore the effects of decline and so simply exacerbated it.
Political apathy and the growing disdain felt by larger and larger proportions of the population in many countries towards the political process have, perversely, encouraged the political class to believe they can get by without considering the needs of more and more people they nominally govern.
Over the last 40 years the cycle has been clear: policies are introduced that destabilise communities and introduce new experiences of poverty amongst the remaining group (Whites) that had not already been squeezed dry economically; that group becomes restless; that restlessness is electorally exploited both by the right shifting to an uglier right and the left shifting to a more right-wing left; despite shifts to ‘social conservatism’ nothing is done about economic conditions of the group; those cynical repositionings therefore do nothing to alleviate or even slow down the decline; the anger increases to the point that the disaffection with established political machinery goes off the scale.
There is the argument, of course, that economic bad times are no excuse for anti-immigrant bigotry, misogyny and racism. But to buy into the individualistic rhetoric of moral condemnation is no answer to the political effects of that same economic hardship.
Once again, poverty is not just about very low income. It is destructive at personal, family, community and societal levels.
To put some human consequences of poverty and decline into focus here’s the abstract from the well known study by Anne Case and Angus Deaton that came out late last year:
This paper documents a marked increase in the all-cause mortality of middle-aged white non-Hispanic men and women in the United States between 1999 and 2013. This change reversed decades of progress in mortality and was unique to the United States; no other rich country saw a similar turnaround. The midlife mortality reversal was confined to white non-Hispanics; black non-Hispanics and Hispanics at midlife, and those aged 65 and above in every racial and ethnic group, continued to see mortality rates fall. This increase for whites was largely accounted for by increasing death rates from drug and alcohol poisonings, suicide, and chronic liver diseases and cirrhosis. Although all education groups saw increases in mortality from suicide and poisonings, and an overall increase in external cause mortality, those with less education saw the most marked increases. Rising midlife mortality rates of white non-Hispanics were paralleled by increases in midlife morbidity. Self-reported declines in health, mental health, and ability to conduct activities of daily living, and increases in chronic pain and inability to work, as well as clinically measured deteriorations in liver function, all point to growing distress in this population. We comment on potential economic causes and consequences of this deterioration.
And to put an even more human face on it, here’s two ‘cases’ of the effects from an article in The Atlantic titled ‘All Hollowed Out: Lonely poverty of America’s White Working Class‘:
One man I talked to was 47 years old, the son of a Detroit factory worker who headed into the plants himself. (As is standard in sociology, my interviewees were promised confidentiality.) He told me how he recently lost his $11-an-hour job: He was driving a forklift at his company’s plant when he accidentally crashed into a ladder. No one was hurt and nothing was damaged—but he was an at-will worker at a company with no union, and he was fired. Shortly afterward, his wife, who was making $8 an hour at a cleaning company, decided to leave him. The stress of failing to find a job and being alone made him too depressed to eat, and he started taking antidepressants.
…
Yet there is clearly more to the despair of the working class than empty wallets and purses. Patches of the social fabric that once supported them, in good times and bad, have frayed. When asked in national surveys about the people with whom they discussed “important matters” in the past six months, those with just a high-school education or less are likelier to say no one (this percentage has risen over the years for college graduates, too). This trend is troubling, given that social isolation is linked to depression and, in turn, suicide and substance abuse.
One form of social support that many in the working class are going without is marriage. I’m reminded of another worker I interviewed, a jobless 54-year-old white woman who used to work at a Ford plant. Her husband left her, she says, when the paychecks stopped coming. “Jesus Christ,” she told him once. “I didn’t think that our relationship was based on the amount of money that I brought in.” Unable to pay her mortgage, she lost her home and had to move in, as she puts it, with a “man friend.” She is depressed, unable to sleep at night, and constantly worried about falling into poverty. “I’m a loser,” she says.
Economic explanations have their flaws. But ignoring economic factors can reduce ‘political’ explanation to unreconstructed psychobabble about ‘attitudes’, ‘ignorance’ and ‘intolerance’.
Unhinged from any appreciation of just what ‘economic’ change means in terms of daily lives and personal experiences such shallow political psychoanalysis can make the explanation of Trump’s support appear far more ‘Black’ and ‘White’ than it really is.